The New York Times recently reported on allegations that a hospital chain was unnecessarily admitting patients from the emergency department (ED) to increase revenues from Medicare and Medicaid[1]. According to the article, one hospital was accused of maintaining a scorecard to keep track of physicians who did not meet a target of admitting at least 50% of ED patients over age 65.
Healthcare reform is creating new financial challenges for many hospitals and there is increasing pressure to find new ways to generate revenue. Certainly, most organizations are not planning to implement illicit programs to meet revenue targets, but these types of stories highlight the need for health plans, employers, and all payers of healthcare to monitor utilization patterns even more closely.
Admission rates from the ED can easily be monitored in MedInsight. A few illustrative examples from a demonstration dataset based on an elderly population are presented below.
Table 1 displays the ED visit rates, percent of ED visits admitted and admission rates across four regions. Region 3 has the highest ED visit rate, the highest percent of ED patient visits admitted, and the highest overall admission rate. These high level statistics do not indicate that any of the ED visits, or resulting admissions are inappropriate, but the findings suggest a reason to evaluate ED admission patterns in Region 3 more closely.
Table 1: ED Visit Rates and Admission Rates by Region
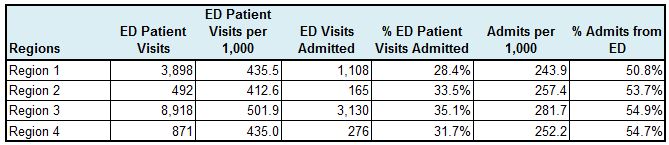
Table 2 displays the number of ED visits and admissions percentage of ED visits admitted for the top 9 hospitals (in terms of ED visits) for Region 3.
Hospital 1 has the highest number of ED visits and the highest percent of ED patients admitted into the hospital. Thirty-nine percent of all ED patients were admitted.
Table 2: ED Visits and Admissions by Top Hospitals
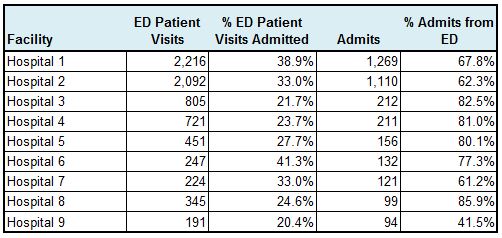
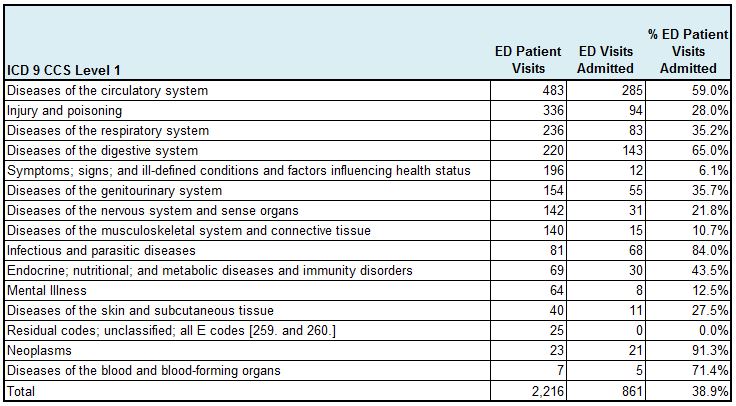
Table 3 displays the ED visits at Hospital 1 by diagnostic category and the percent of visits within each category that were admitted to the hospital. Sixty-five percent of the visits for digestive conditions and 59% of visits for circulatory disorders were admitted to the hospital.
Table 3: Hospital 1 Admissions by ED Visit Diagnosis Category
[1] Abelson, R. & Creswell, J. (2014. January 23). Hospital Chain Said to Scheme to Inflate Bills. The New York Times, retrieved from www.nytimes.com.